Tx-Multiscan
Tx-Multiscan: Technical Specifications
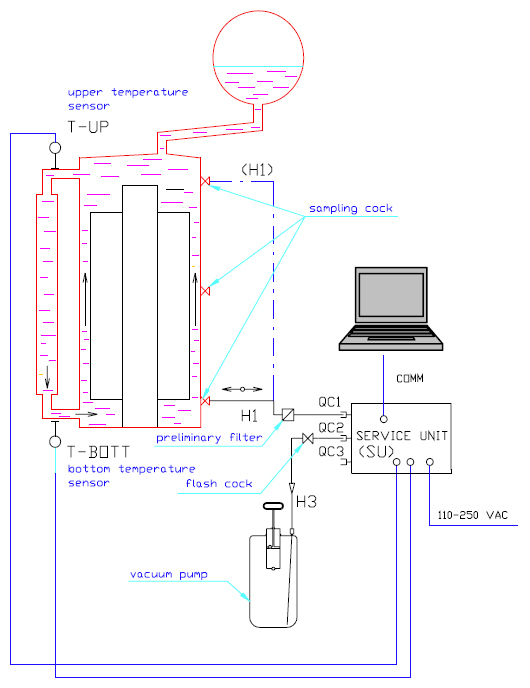
Tx-Multiscan-1P is connected to one central sampling point, midway up the Tx-main tank. Having evacuated the hose H1, Tx-Multiscan periodically draws the oil sample down, analyses it and returns it to the transformer. These steps clear the lines and ensure that the sample always represents the pattern of oil inventory. It is highly convenient for smaller transformers, or larger transformers with the oil sampling points directly connected to the oil in the main tank without any internal piping. Temperature sensors are connected to the bottom and top sleeves connecting the main tank with radiators allowing an average Txtemperature to be established. Alternatively it can be connected to the top or bottom oil sampling cocks, with care taken of the analysis on the "average" level of the water content in the oil inventory.
Tx-Multiscan -1P can be used for quick online snapshots of water in the oil and temperature profiles.
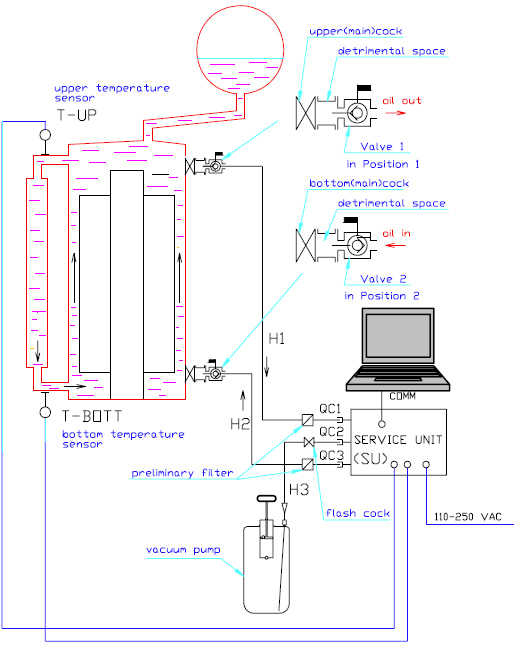
Tx-Multiscan–2P is connected to two oil sample taps, one at the top one at the bottom od a Tx. Then, both connecting hoses are evacuated to avoid contamination by air-moisture. The oil is then drawn continuously through the Tx- Multiscan unit and passed back to the transformer. Independent temperature sensors are fitted to the designated top and bottom positions. Once Tx-Multiscan –2P is installed, connected and started (within ca 10 minutes), the transformer´s top (T-UP) and bottom temperatures (T-BOTT) and water content in the oil Qw (ppm) are recorded in a time based log. Within ca 30 minutes an accurate snapshot decision info - if the adequate equilibrium is reached or not - is obtained. That allows precise accuracy in determining water levels in the solid insulation, and the temperature related movement and time lag of the water movement between the paper and the oil.
The dielectric strength and load risk at peak load can be determined more accurately. While online, the data can be accessed directly by lap-top, the graphs of trends produced, and saved as a file.
For more details See please Tx-Multiscan Manual